

Measurable posture, exposure under control
Vortex Cockpit is the Vortex Security posture and exposure management platform. It consolidates data from the security tools already in place, proves the effectiveness of controls, measures posture against NIST CSF 2.0 and turns each risk into an action with an owner and a deadline, in a single view for the board, the CISO and operations.
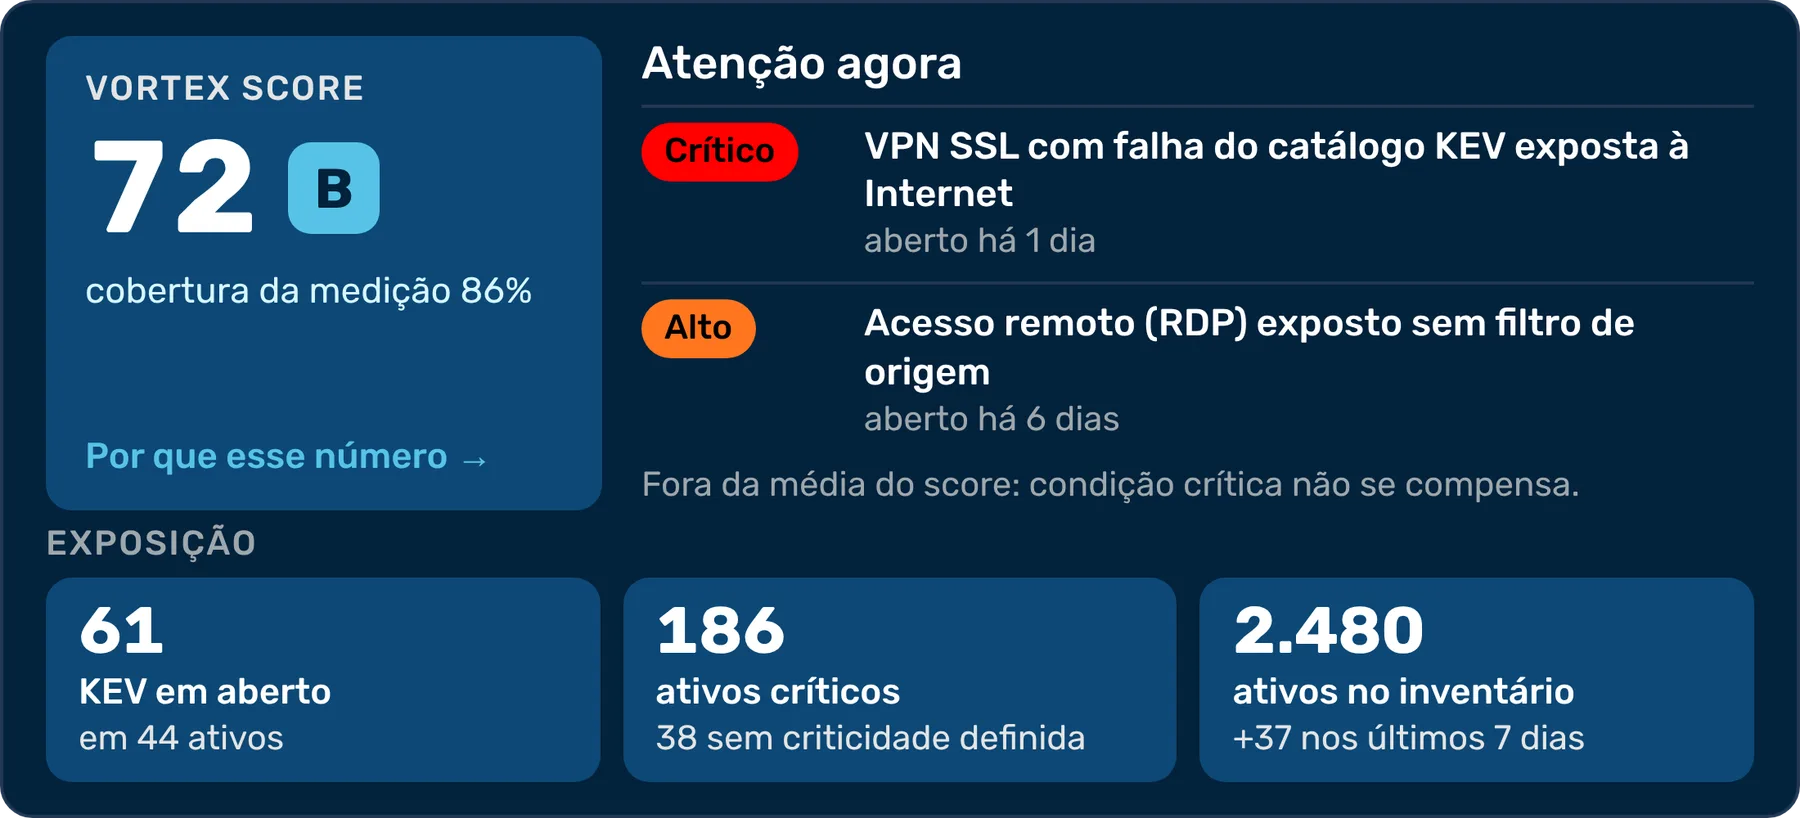
In short: Vortex Cockpit is the Vortex Security posture and exposure management platform. It consolidates data from security tools, checks 100 technical controls every day, measures posture as a score from 0 to 100 based on NIST CSF 2.0 and organizes remediation through the CTEM cycle, with views for the board, the CISO and operations.
Security investment is not, in itself, evidence of protection
- 01
Silent degradation of controls
Temporary exceptions that become permanent, new assets outside the EDR policy, interrupted log sources. These are deviations that raise no alert and, month after month, reduce the protection you have contracted.
- 02
Indicators without traceability
Third-party ratings with closed methodologies do not support accountability to the board, which needs to know what was measured, over what scope and with what reliability.
- 03
Remediation without governance
Identifying and prioritizing vulnerabilities is only the beginning. Without an owner, a deadline and follow-up, findings pile up and the risk remains.
A consolidated, decision-oriented view of the environment
Cockpit integrates with the tools the organization already operates, without replacing them, and consolidates endpoint, vulnerability, firewall, identity, SIEM, OT, cloud and threat intelligence data into a single base.
Each dashboard first presents the current state, the points that require attention and the next recommended action; the details come next. Every indicator shows its source, the collection date and its degree of reliability.
- Integration with around 40 security technologies
- Dedicated views for the board, the CISO and operations
- Monthly close with reports and executive presentations
Two indicators for the questions the board asks
Both are calculated with data from the environment itself, with a transparent methodology explained measure by measure.
- Control Posture 100 technical controls verified every day
Are the contracted controls configured and in operation? The check is made directly in the tools and shows how much of the contracted protection is actually active.
How it works - Vortex Score 0 to 100 a single score, with 41 measures across ten NIST CSF 2.0 dimensions
What is the current posture, and how reliable is that measurement? The score always comes with the measurement coverage.
How it works
Control effectiveness proven every day
Control Posture checks every day, directly in each tool, whether the expected controls exist, are enabled and reach the entire estate, from the firewall and EDR to the SIEM, identity and OT.
There are 100 technical controls across 23 technologies, each with a vendor reference and remediation guidance in Portuguese. Weighting by criticality makes the indicator accurately reflect where the risk is greatest.
Each failed control generates a remediation action with the corresponding posture gain, and the actions are ranked by return: greatest gain for the least effort first.
A security score fit to be presented to the board
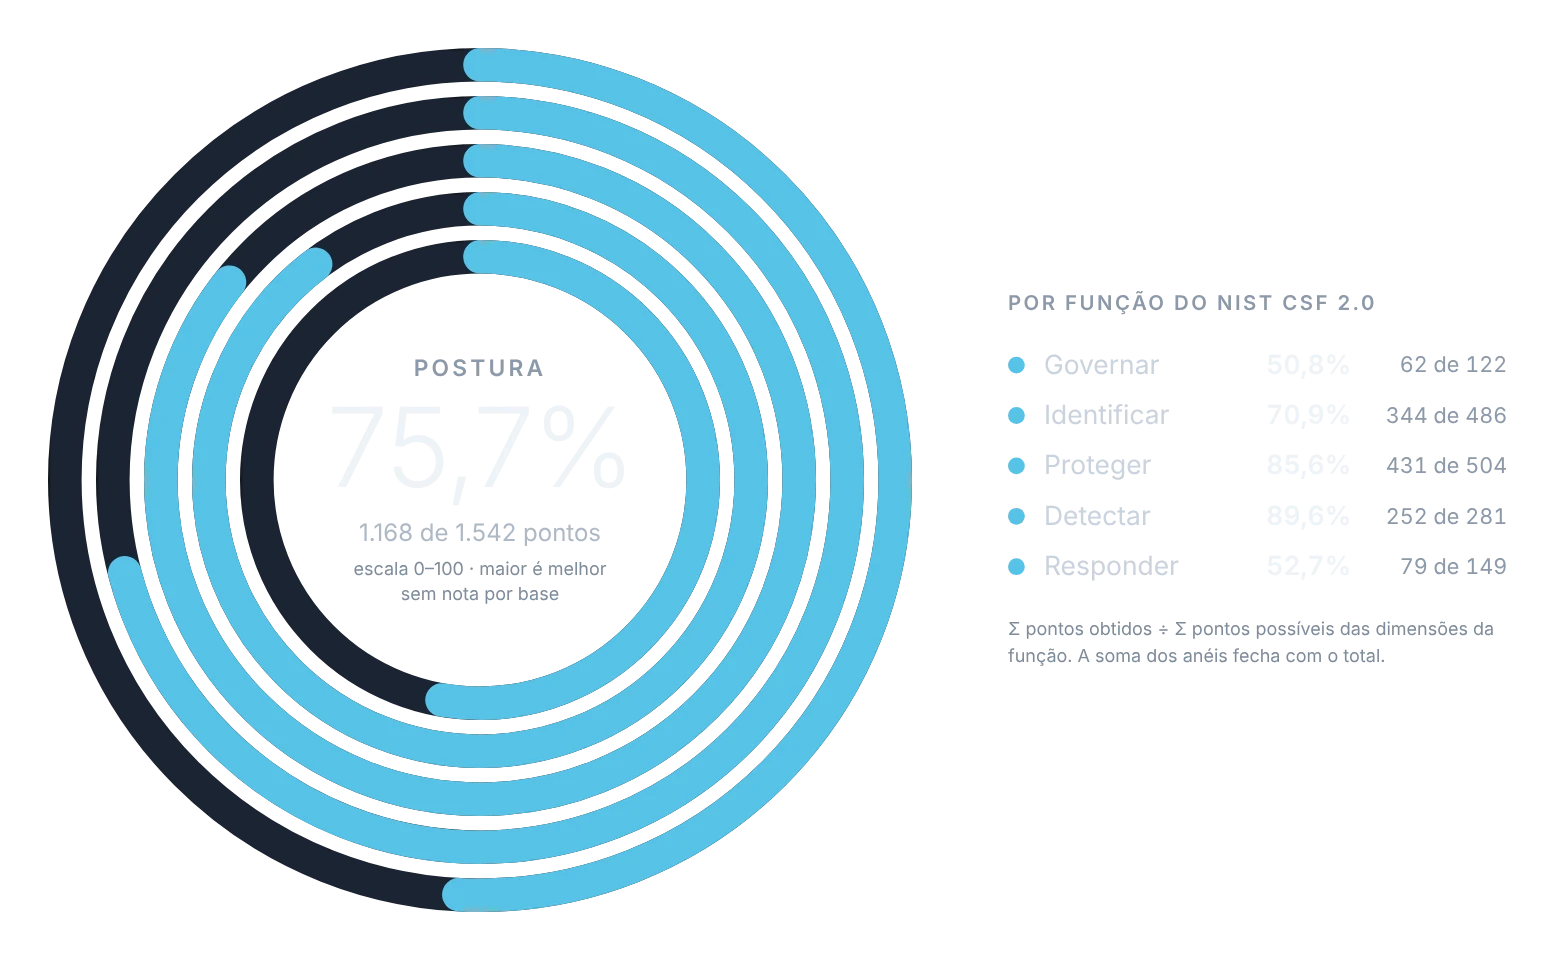
Vortex Score expresses security posture as a score from 0 to 100, graded from A to E, structured by five of the six NIST CSF 2.0 functions: Govern, Identify, Protect, Detect and Respond. It translates security into executive language, with the rigor that audits require.
The score is always presented with the measurement coverage: a 72 measured over 90% of the environment is not the same as a 72 measured over 30%. Measures older than seven days are disregarded, so that the indicator reflects the present.
With coverage below 50%, no score is published: Cockpit records “not measured” and the reason, instead of presenting a number that does not hold up.

Traceability for every point of the score
The 41 measures are distributed across ten dimensions and are fed by the client’s tools, such as Tenable, SentinelOne, Claroty, Google SecOps, Fortinet and Apura, and by observation of the external surface. The Detect and Respond functions account for one third of the model, reflecting the weight of the 24x7 operation of the Cyber Defense Center (CDC). The weights can be adjusted to each organization’s context.

From indicator to remediation
Each level of detail shows the collected value, the source and the date, and Cockpit projects the Score gain associated with each fix.
Score
Score, grade and coverage of the environment.
Function and dimension
The NIST CSF function and the dimension that lower the score, with their weight.
Measure
Collected value, source and collection date.
Action
Recommended remediation and the corresponding point gain.
Ticket
Request to the CDC with a tracking number, integrated with the organization’s ticketing system.
Indicators built to support decisions
- 0% to 50% Not measured No score published: Cockpit records “not measured” and the reason.
- 50% to 80% Score capped at 85 Excellence is not attested over a partially measured environment.
- 80% to 100% Score without this cap Always accompanied by the coverage.
- Missing data is not zero Zero means verified and failed. What could not be verified is shown as “no data”, with the justification, and is treated neither as compliant nor as a failure.
- Coverage always explicit Every score shows the share of the environment actually measured. With coverage below 80%, the score is capped at 85: excellence is not attested over a partially measured environment.
- Stability with sensitivity to risk Synchronization delays and occasional source outages do not distort the indicator, which is smoothed and has a daily variation limit. New critical risks, however, are reflected immediately.
- Gaps with an identified origin Every data gap is classified by cause: technology not contracted, survey pending on the Vortex side or source not sending data. Responsibility for each gap is made explicit.
History is recorded daily, and every methodology change is marked on the timeline, with the justification.
Continuous threat exposure management
CTEM (Continuous Threat Exposure Management), a model defined by Gartner, replaces point-in-time assessments with a continuous five-stage cycle. In Vortex Cockpit, this cycle structures the platform: each technology’s dashboards are organized by stage, and the Executive View follows the same sequence.
What is within the program’s perimeter, and what is outside it?
Formal delimitation of what is part of the exposure management program. Each client’s scope is recorded with authorization, and Cockpit compares what was contracted with what is actually in use.
In Vortex Cockpit- Approved scope and recorded authorizations
- Comparison between what was contracted and what is actually in use
- Basis for calculating the Vortex Score coverage
What is the organization’s current exposure?
Continuous identification of the attack surface, before an adversary does it. Cockpit consolidates the inventory from all sources, reveals unmanaged assets and monitors what is visible about the organization on the internet.
In Vortex Cockpit- Unified inventory, including unmanaged assets
- Lookalike domains, DNS, certificates, buckets, secrets in code and fake profiles
- Vulnerabilities, identity and OT in a single view
What should be addressed first, and on what grounds?
Prioritization based on real risk, not just theoretical severity. Cockpit considers the active exploitation of vulnerabilities and the paths that lead to the business’s critical assets.
In Vortex Cockpit- Active exploitation before severity: KEV, EPSS, public exploit and reachability
- Priority queue from P0 to P3, with justification
- Attack paths to critical assets
Which defenses are proven to be effective?
Proof of control effectiveness, in place of assumptions. Control Posture and per-asset validation show where an effective barrier exists.
In Vortex Cockpit- Control posture and coverage verified daily
- Per-asset validation of each CVE and attack path
- Exposure tests only with an approved scenario, authorization and evidence, and never in OT
Who is responsible, what is the deadline, and is remediation progressing?
Governed execution of remediation. Each action gets an owner, a deadline and the expected gain, and is routed to the CDC and to the organization’s ticketing system.
In Vortex Cockpit- Actions ranked by return
- Owner and deadline for every action; without an owner, the gap is declared
- Requests to the CDC with tracking numbers and decisions recorded in the Executive View
Operational maturity of the program, measured stage by stage
For each of the five stages, Cockpit shows whether data is being collected and what still needs to be integrated. An interrupted source is reflected immediately, because CTEM is a continuous cycle, not a maturity that accumulates.

Asset inventory consolidated from all sources
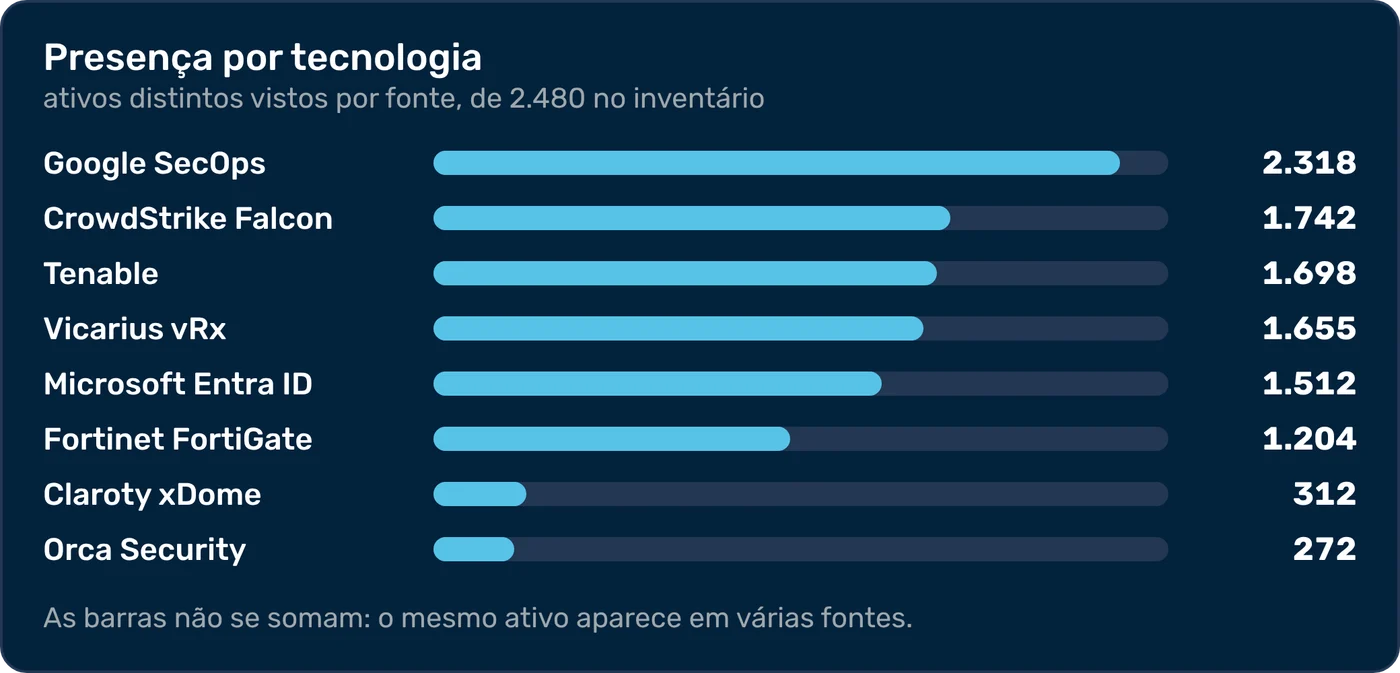
Each tool sees only part of the environment. Asset Inventory consolidates servers, workstations, network equipment, cloud resources and industrial assets into a single record per asset, even when several sources identify it.
Discrepancies between sources are not resolved automatically: they are sent for analysis, decided by an owner and recorded with the justification. Assets identified by a single source are flagged as possible unmanaged assets.
Each asset has a profile with its business criticality, the service it supports, the tools that cover it, open vulnerabilities and end-of-support date. Risk alerts are issued when the score drops, a new vulnerability appears or the configuration changes.
- Single record per asset, with each source’s view
- Conflicts between sources resolved with a recorded decision
- Profile with criticality, business service, coverage and vulnerabilities
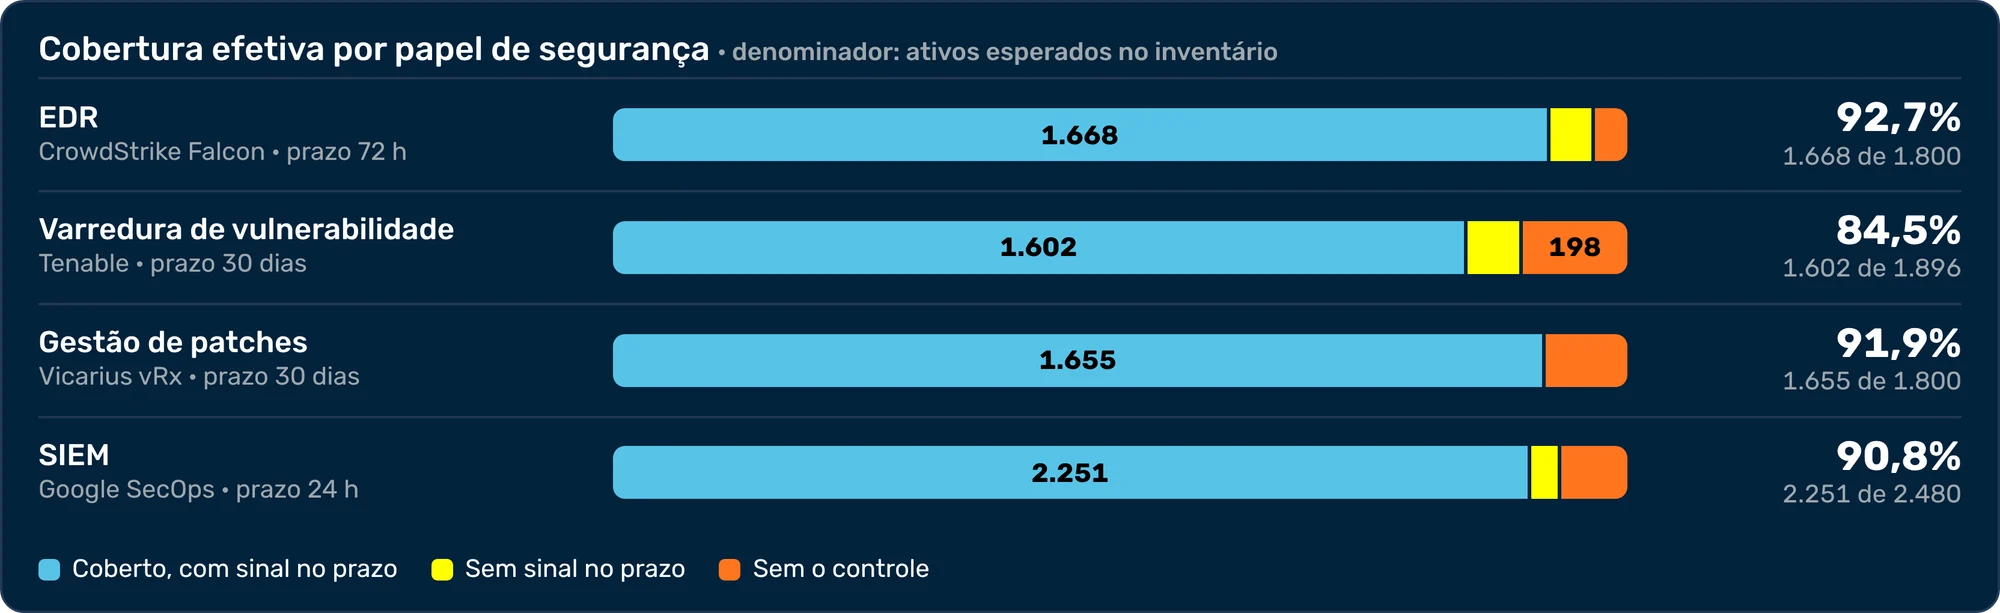
Cross-coverage: where controls do not reach
An installed agent is not the same as a working agent. Cross-coverage checks each tool against the inventory and shows, by security function (EDR, vulnerability scanning, patch management and SIEM), the assets covered with a timely signal, those that have stopped reporting and those without the control.
Because the basis of calculation is the inventory, not the tool’s own declaration, no gap stays hidden. Each uncovered asset generates a recommended action, such as installing the agent or restoring the signal, and the same analysis identifies undeclared assets, such as the organization’s own IPs outside the inventory or unregistered cloud environments.
The attack surface from the adversary’s perspective
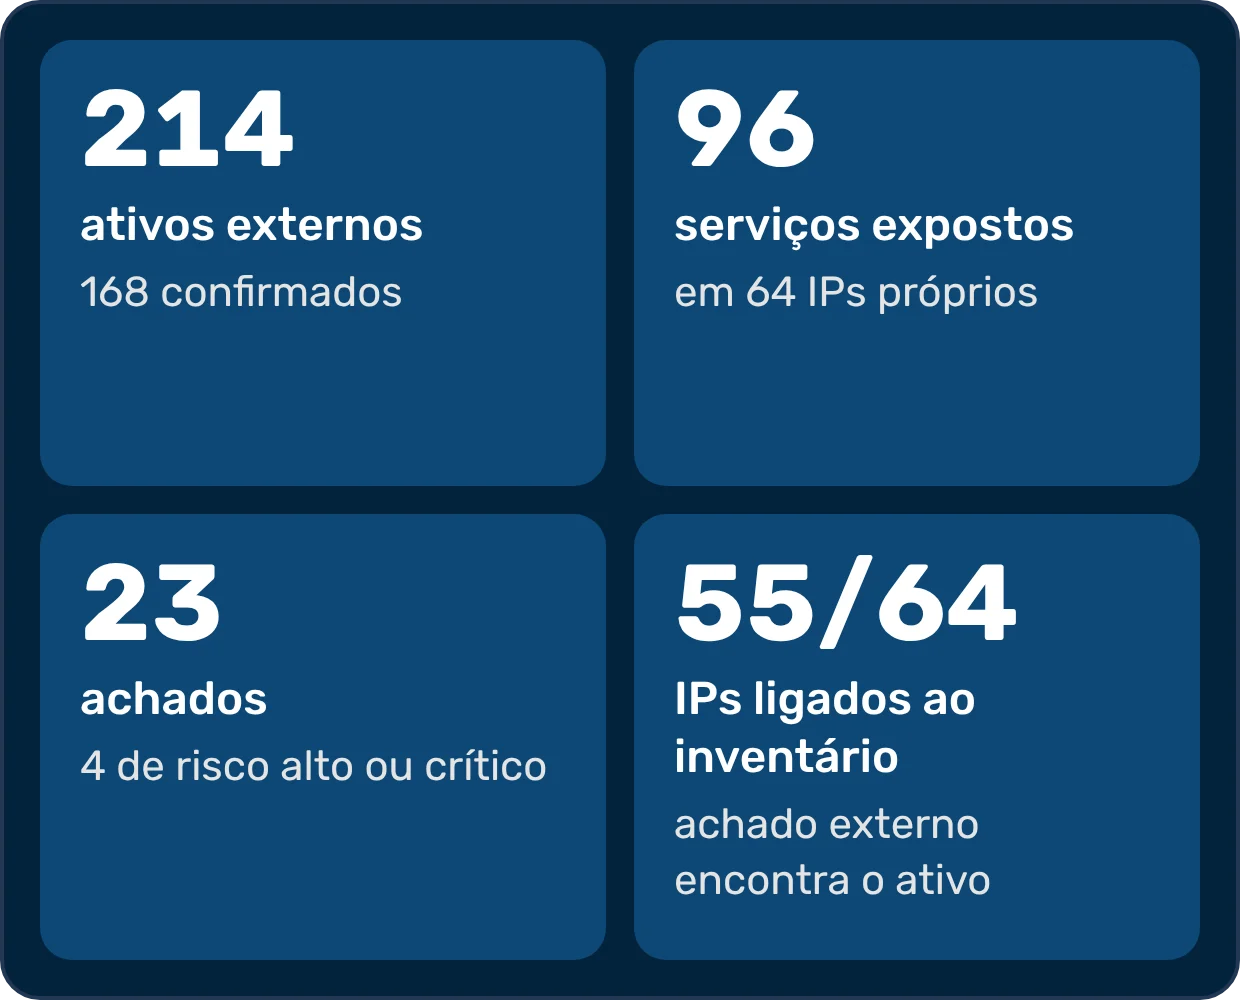
External reconnaissance is the first stage of an attack. External Surface performs this same reading every day, passively and without interacting with the systems: domains, subdomains, IPs, exposed services and certificates visible on the internet.
Each external finding is correlated with the corresponding asset in the inventory, which gives an exposed port a name, an owner and a criticality. When the scope authorizes it, active scanning runs only on the registered IP ranges, and the analysis is complemented by the DNS zone, the firewall configuration and Shodan queries.
Threat Intelligence completes the external view by monitoring leaked credentials, fake sites, profiles and apps, secrets exposed in public repositories and fraud offers against the brand, with a takedown queue.
- Passive discovery, without access to the internal network
- Correlation of each external finding with the inventory
- Integration with Tenable Exposure Analytics
- Assessment of critical suppliers from A to E, using external data only
Attack paths and cut points
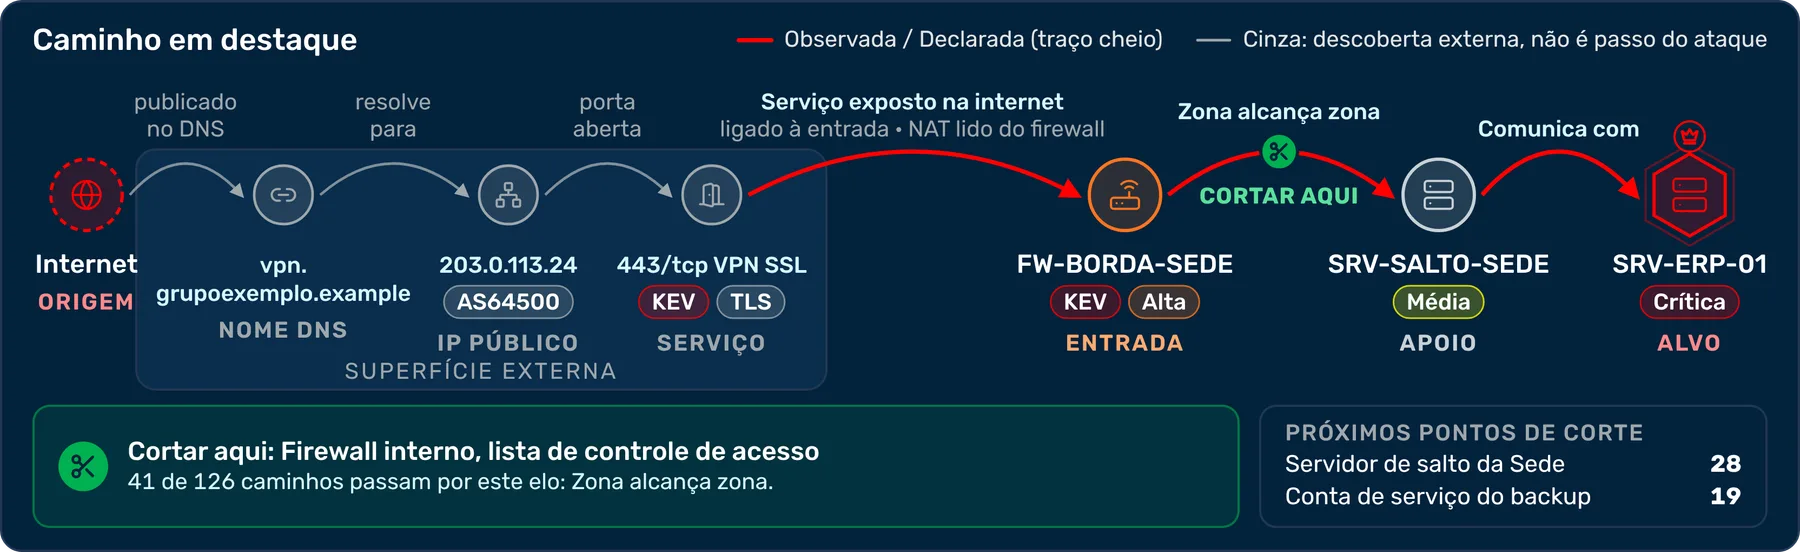
Cockpit maps the paths that lead from the internet to critical assets and identifies the cut points: the fixes that, on their own, break several paths at once.
Fixing a vulnerability does not necessarily eliminate the path; restricting reach does. That is why each cut point shows how many paths it isolates, and each link is backed by observed or declared evidence.
Defense effectiveness proven by controlled simulation
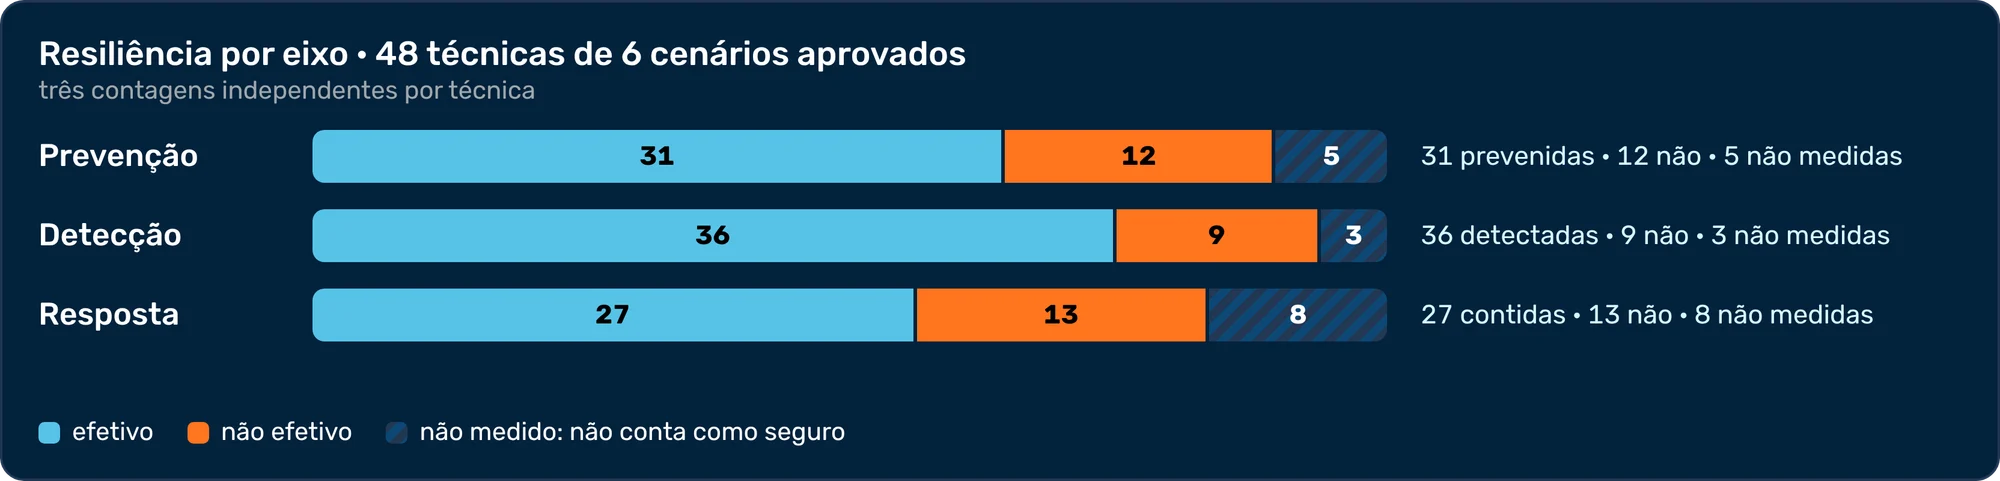
A mapped attack path is still a hypothesis. Exposure Validation turns it into evidence by running scenarios based on MITRE ATT&CK techniques and demonstrating, technique by technique, what was prevented, detected and contained. What has not been tested is not considered secure.
Each scenario runs only with a designated approver, a valid authorization and an eligible target, always in a test zone declared by the client. In OT environments, tests take place exclusively on replicas.
The results generate actions: undetected techniques are sent to the CDC with a tracking number, controls that failed to prevent go back to posture review and confirmed paths move up the priority queue. After the fix, the finding is only closed after a new verification at the source.
The right information for each decision level
- Operations An objective priority queue, with the justification for each item and follow-up on each fix through to closure.
- CISO and GRC Security program performance: remediation deadlines, accepted risks, compliance, audits and budget.
- Board and CEO Adherence to the approved risk appetite, evolution of exposure and decisions that depend on senior management.
Integrated management, from dashboard to executive report
Dashboards by technology
Around 40 technologies, from endpoint and firewall to identity, OT, SIEM and cloud, each with an operational view and analysis through the CTEM cycle.
Requests to the CDC from the finding
Requests recorded on the finding’s own screen, with a tracking number, completion criteria and deadline, and the response followed up in My requests (Minhas solicitações).
Automated executive reporting
Presentations generated with the period’s data, in PPT and with the client’s visual identity, in versions for the CISO and for operations, plus schedulable PDF reports.
Deployment in three stages
Once the sources are connected, the first Vortex Score is published in the following cycle, with the measurement coverage, the gaps identified and the highest-return actions.
Scope approval
Joint validation of domains, IP ranges and authorizations.
Source connection
Integration of the tools with Cockpit, testing each credential.
First reading
Diagnosis of what is already measured and what still needs to be integrated.
First Vortex Score
Published in the following cycle, with the coverage, the gaps and the highest-return actions.
Frequently asked questions
Does Vortex Cockpit replace the company’s security tools?
No. Cockpit connects to the tools the organization already operates, from endpoint, vulnerabilities, firewall and identity to SIEM, OT, cloud and threat intelligence, and consolidates the data into a single base, without replacing any of them. There are around 40 technologies, and each connected tool gets its own dashboard, with day-to-day indicators and analysis through the CTEM cycle.
Where does Cockpit’s data come from, and what if a tool has no API?
From three types of source: the client’s security tools, connected via API; the sources Vortex adds, such as passive discovery of the external surface, threat intelligence and the CVE database; and manual records, in the executive registers or by spreadsheet, for what no tool collects on its own. Without an API, files such as CSV, .nessus and Microsoft exports go through the same collection engine, with validation before saving. Every indicator shows its source and the collection date.
What is the difference between Control Posture and Vortex Score?
Control Posture answers a concrete question: are the contracted controls configured and in operation? Every day, it checks 100 technical controls across 23 technologies directly in the tools, weighted by criticality. Vortex Score measures security posture as a whole, with 41 measures across ten NIST CSF 2.0 dimensions, as a score from 0 to 100 graded from A to E, always accompanied by the measurement coverage.
How does Vortex Score handle environments that are only partly measured?
The score is always presented with the measurement coverage. Below 50% coverage, no score is published: Cockpit records “not measured” and the reason; below 80%, the score is capped at 85. Missing data never counts as zero: it appears as “no data”, with the cause identified, whether technology not contracted, survey pending on the Vortex side or source not sending data. Measures older than seven days are disregarded, so that the score reflects the present.
How does Cockpit prioritize vulnerabilities?
By active exploitation before theoretical severity. Vulnerability Management brings together the flaws found by all the tools in a short queue, from P0 to P3, and each priority comes with the reason in writing: whether the flaw is already exploited by attackers (CISA’s KEV catalog), whether the asset is reachable from the internet, whether it is critical to the business and what the estimated probability of exploitation is (EPSS). Each priority has a remediation deadline, which feeds the remediation window tracked by the CISO.
Does Cockpit run attack tests in the client’s environment?
Only in Exposure Validation, which runs scenarios based on MITRE ATT&CK techniques to show, technique by technique, what was prevented, detected and contained. Each scenario requires a designated approver, a valid authorization and an eligible target, always in a test zone declared by the client, and in OT environments tests take place exclusively on replicas. The external surface reading is passive, and active scanning only takes place when the scope authorizes it, and only on the registered IP ranges.
Is one client’s data isolated from the others?
Yes. Each record belongs to a single organization, and the database itself restricts each user’s access to the authorized information. Tool credentials are kept in a vault, with two-factor authentication and an audit trail.
How long until the first Vortex Score is available?
The first Vortex Score is published in the cycle following the connection of the sources. Before that, the scope is approved jointly (domains, IP ranges and authorizations), each tool is integrated with a credential test, and the first reading shows what is already measured and what still needs to be integrated. The score comes out with the measurement coverage, the gaps identified and the highest-return actions; without collection, coverage is zero and there is no score.
Request a Vortex Cockpit demo
We present the platform in a demo environment, with fictitious data, along with the plan for integrating it into your environment.
- Free diagnostic
- Fast response
- Personalized service
Updated on